Zenbus produces, processes, structures and stores a huge amount of transit data. Zenbus also collects interesting data on ridership and how our interfaces are used. Several modules can be used to analyse these data and statistics.
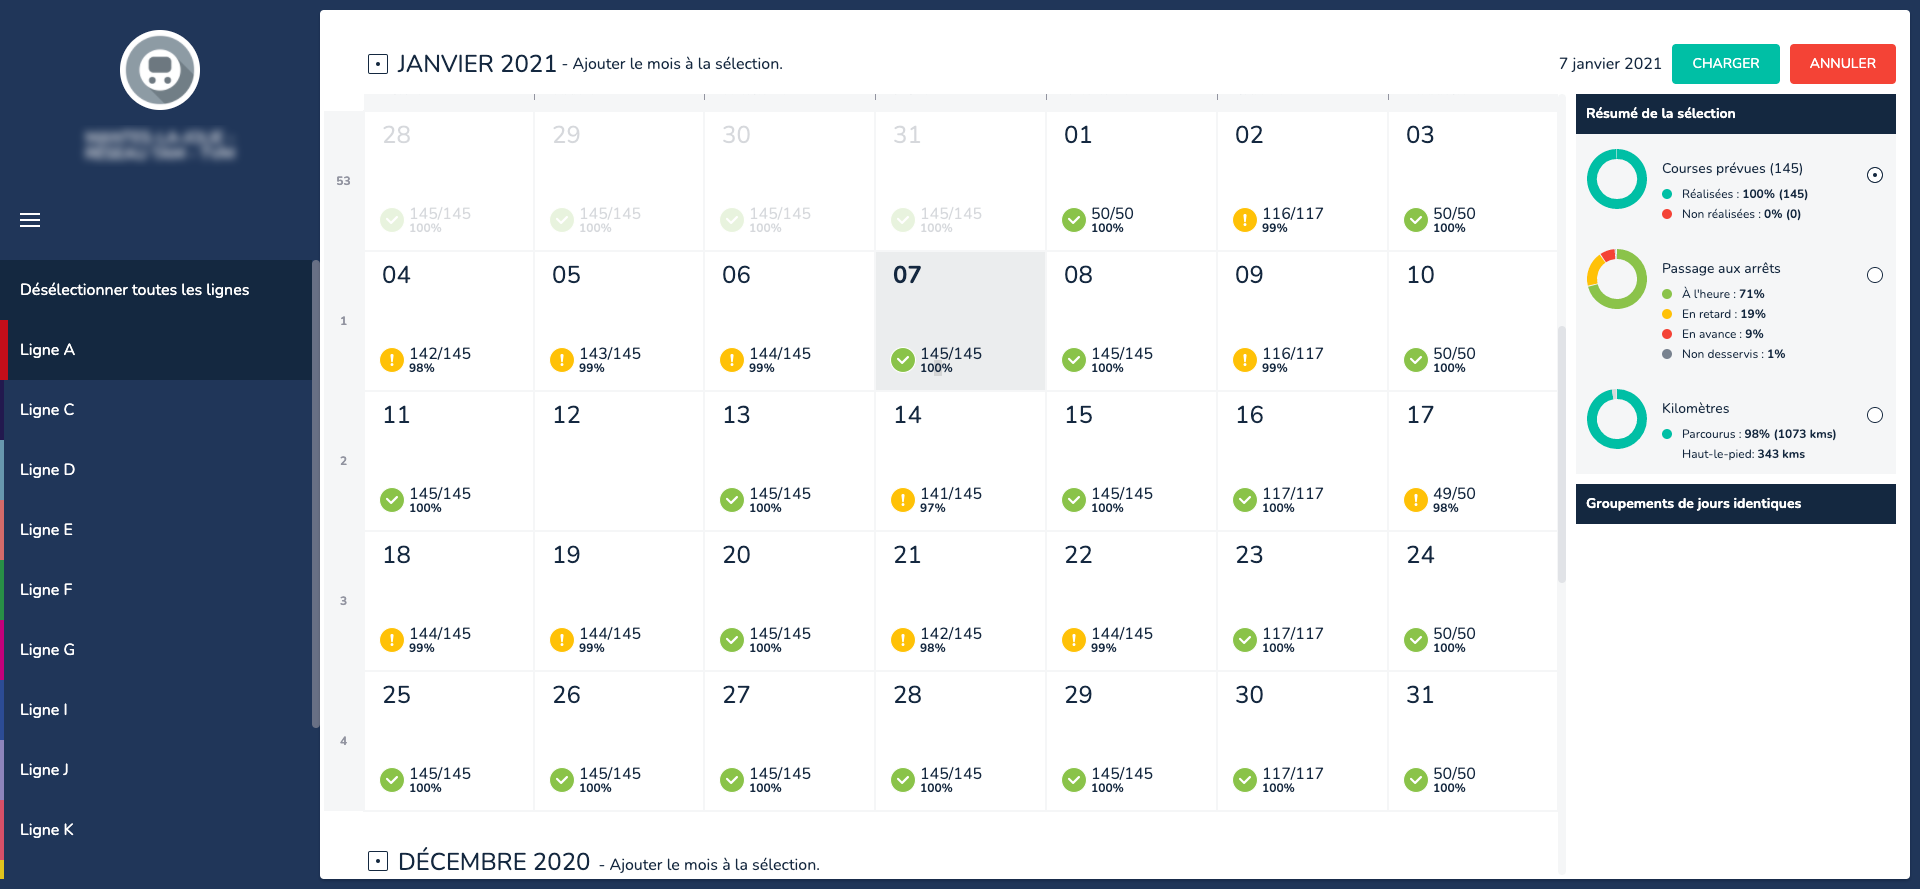
This interface provides an instant summary of actual trips vs. theoretical trips, punctuality at stops and kilometres travelled, for part or all of a network. This information can be exported in .csv format and is accessible for an unlimited period of time, making it easy to generate monthly reports.
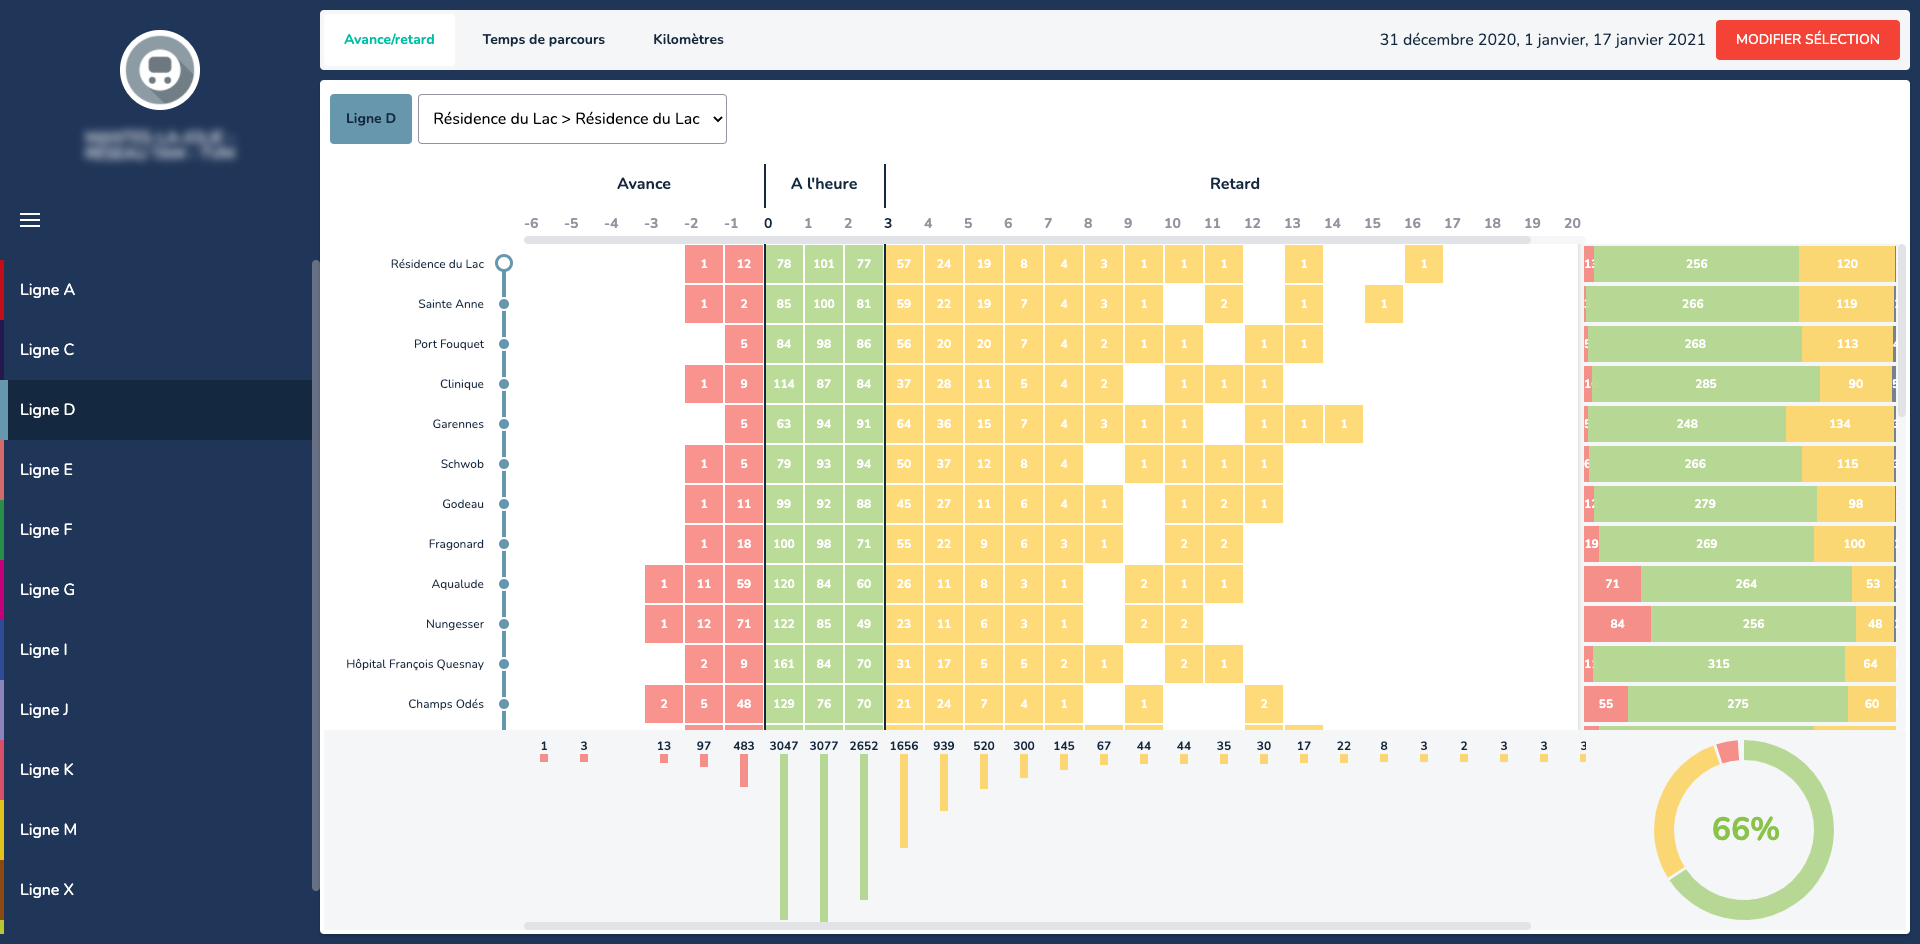
This interface provides details on the punctuality by stop or by line over a selected period.
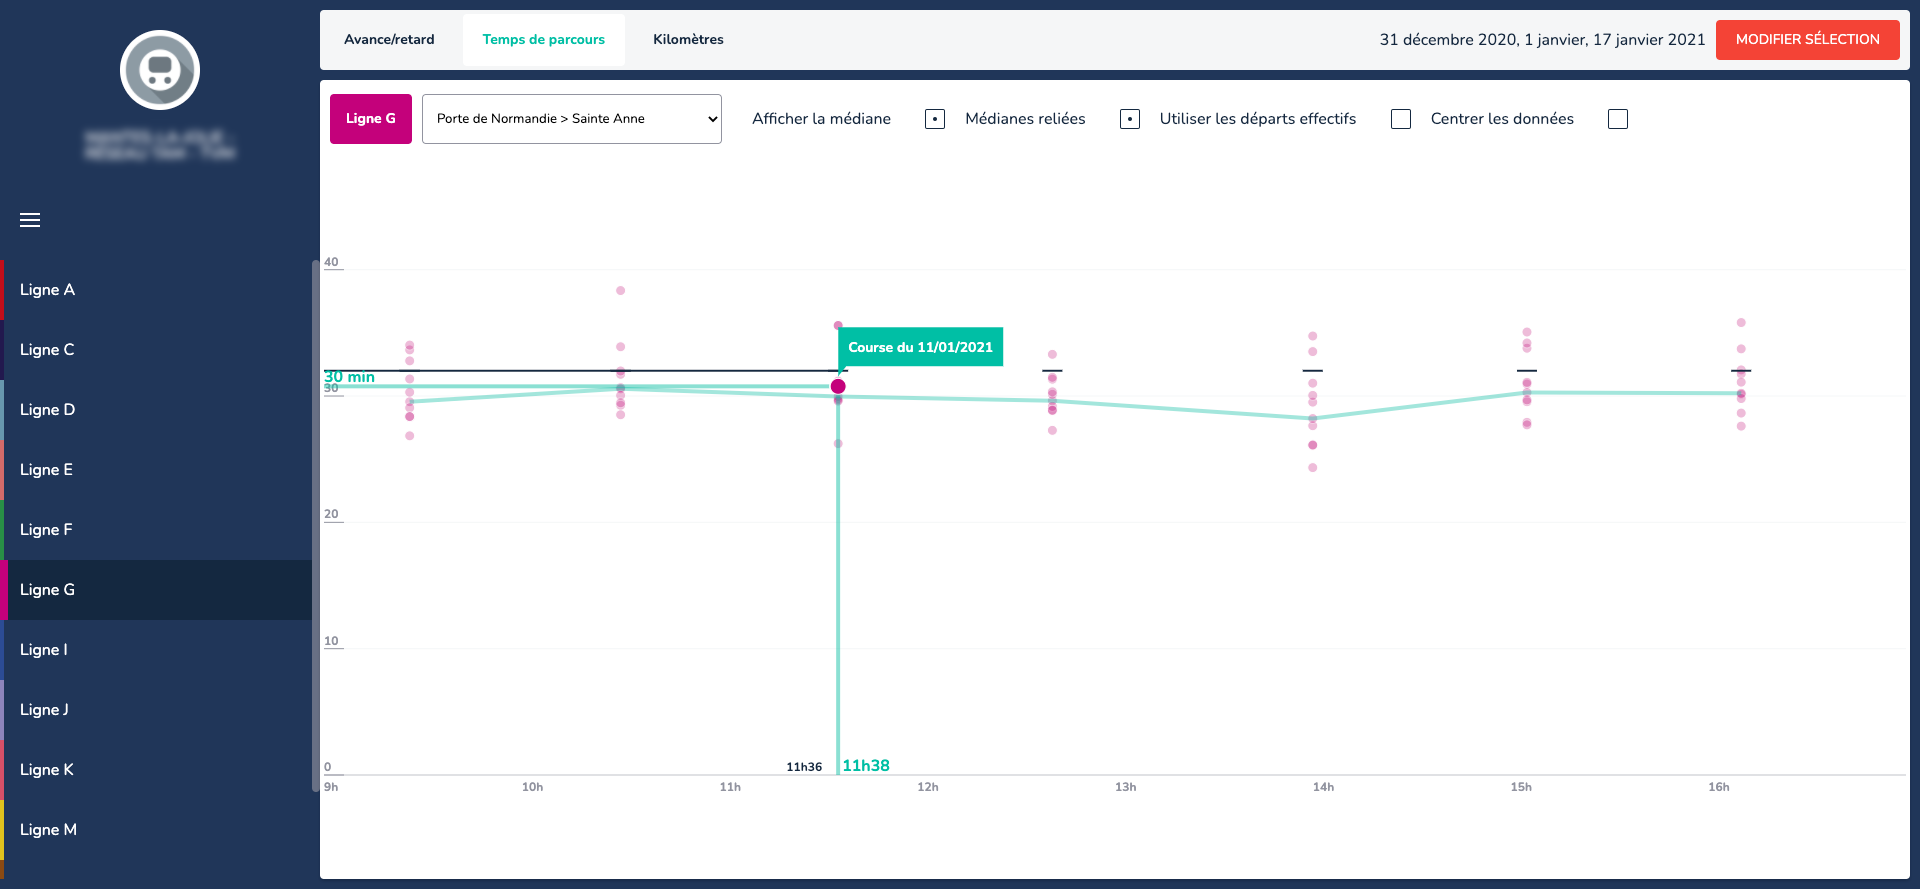
This interface displays the travel times for a same route over a selected period, including median times and the difference between the theoretical and actual times. The trips can be replayed by clicking on any point on the graph.
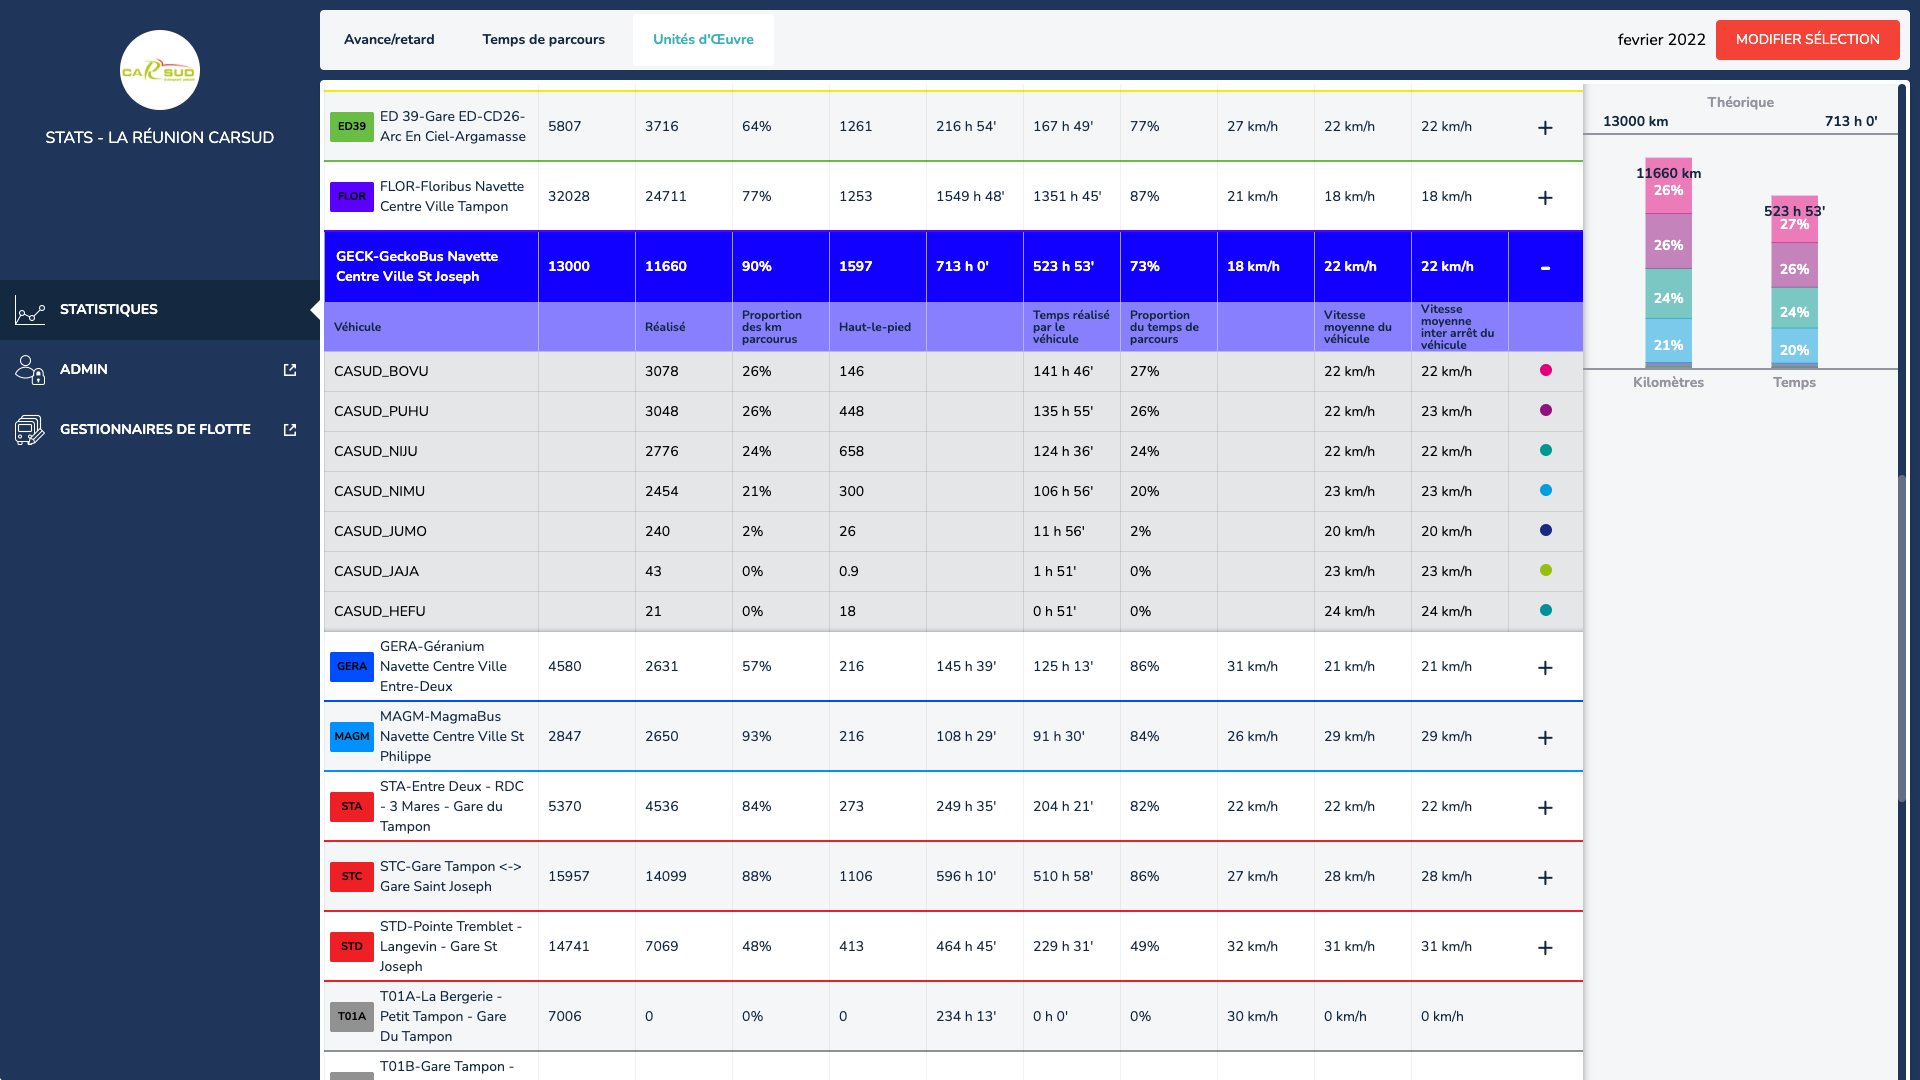
This interface displays kilometres travelled by line, by vehicle, for a selected period (revenue trips and deadheading) as well as the average speed and speed between stops.
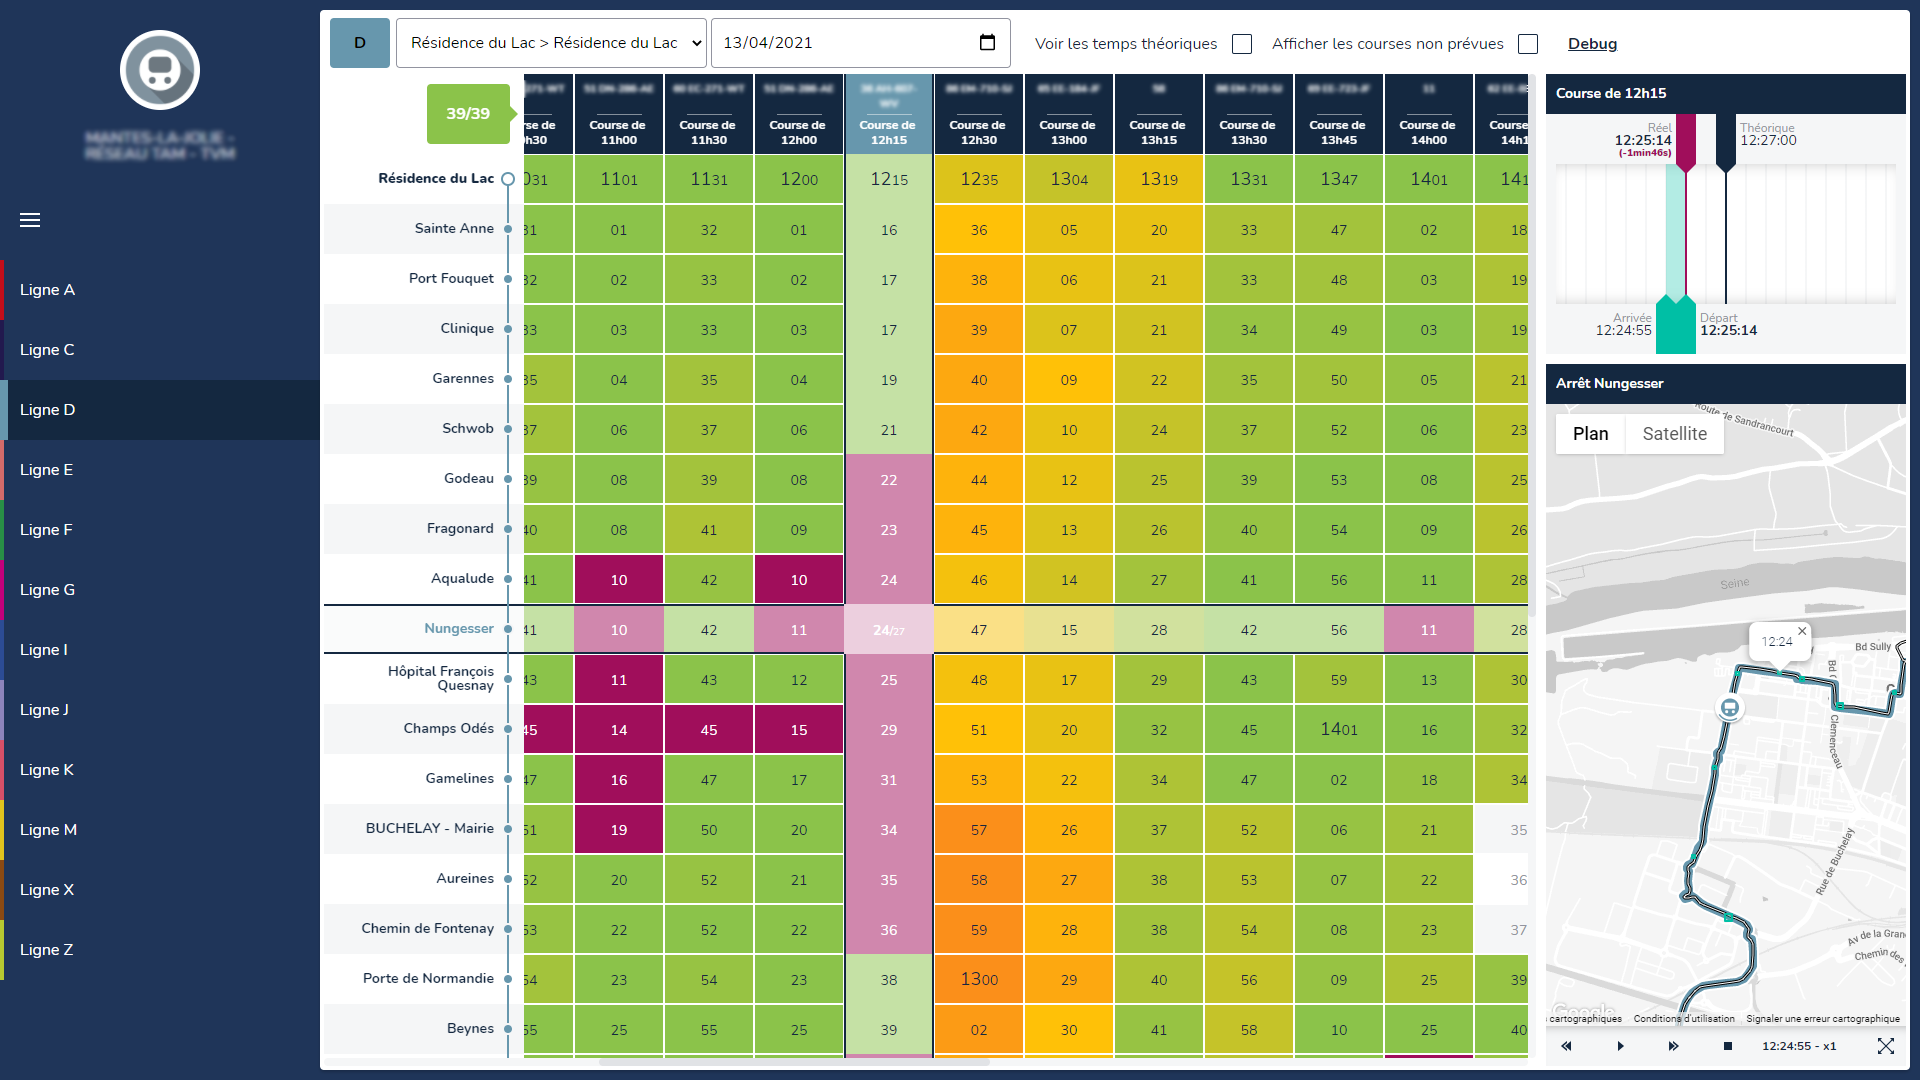
This interface displays the arrival times down to the second and the difference with the theoretical times, by line, by trip and by vehicle. It also provides a replay function.
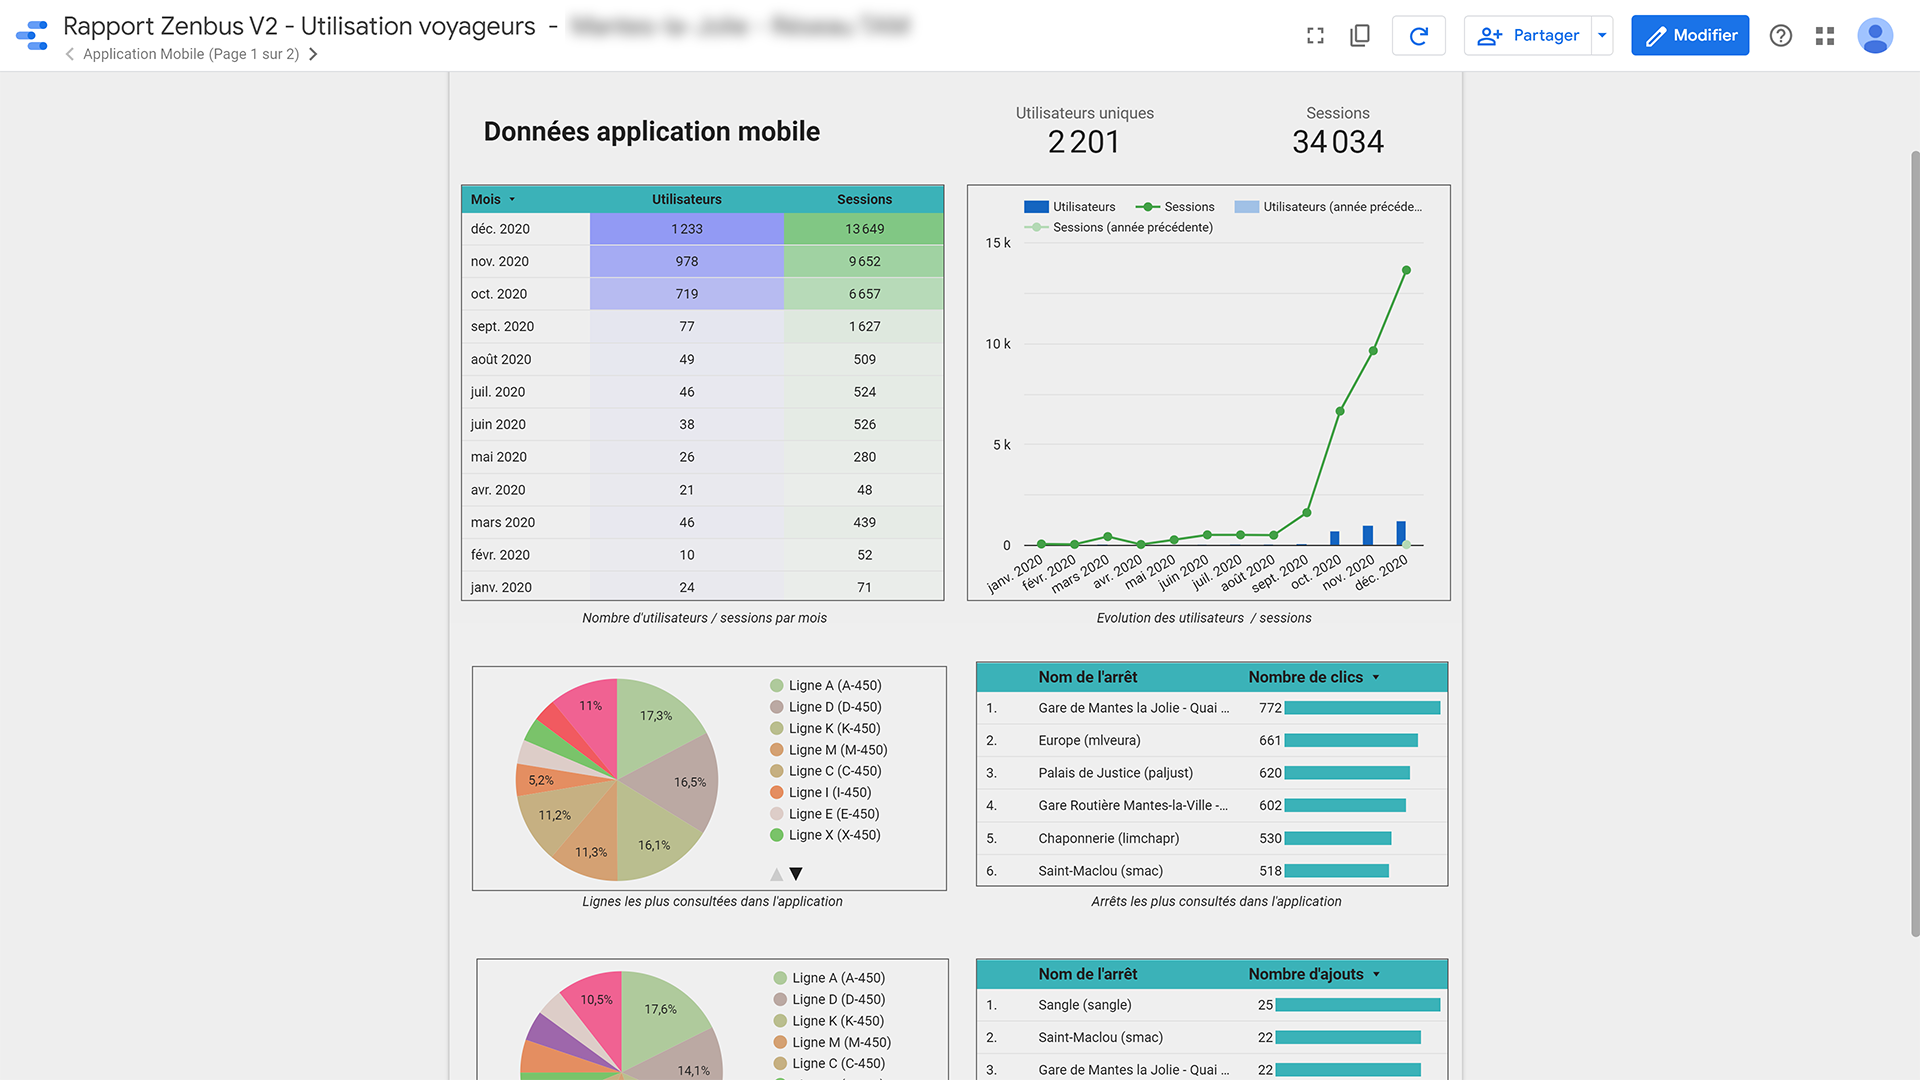
Zenbus provides monthly usage reports of the application and Zenbus iframe, including an overview (number of users, number of sessions) and a detailed version (lines and stops used, lines and stops added to favourites, geographical origin of the user).
Zenbus can conduct user surveys to get their feedback on their transit system or on mobility in general, through the Zenbus messaging system on the app and online.
Une fonction comptage accessible directement sur le terminal du conducteur dans Zenbus Driver permet de recueillir les données de montées-descentes de voyageurs par lignes, arrêts et date.